|
||||||||||||||||||
|
The Global Carbon Cycle |
||||||||||||||||||
Take away ideas and understandings:
Introduction. Understanding the carbon cycle is the first step toward understanding possible impacts of the human-induced rise in greenhouse gasses. Carbon is the elemental building block of all life and as such, it is stored and exchanged between different reservoirs, each of which has its own characteristic size and response time. The main carbon reservoirs are carbonate rocks (limestone), soils, land plants, the oceans, the atmosphere. The aim of this lecture is to give you an appreciation for how large the carbon reservoirs are, what the important fluxes of carbon are between reservoirs, how we conduct mass balances between the reservoirs, and finally to underscore the magnitude of anthropogenic CO2 increases relative to these reservoirs and fluxes. Through fossil fuel burning and land use changes humans have started a grand, uncontrolled experiment with carbon on earth. We now recognize that this experiment will change our climate, and the potential effects on people's lives have stimulated some of the largest public and policy debates of any scientific topic today. There have been times on earth in the past when the CO2 concentration of the atmosphere has been both much less and much greater than it is today. If it has been greater, then one might ask "why are we so worried, the CO2 concentrations were greater than they are today and we still survived?" The answer to that question lies in the fact that the rate of change of CO2 in the atmosphere is faster today than at anytime in earth's history. It is this rapid increase in CO2, not necessary the final CO2 concentration that we may achieve, which is driving much of our concern. For example, because organisms
(and certainly all of the human cultures on earth) have never been
exposed to such rapid rates of CO2 increase, we don't know how they
will respond and whether they will be able to adapt quickly enough
to survive. These are the questions that science and society
are struggling with today. While we know that CO2 concentrations
are increasing, there have been several plans or ideas on how to control
them "naturally", such as plant more trees to take up the excess CO2.
Later in the lecture we will examine two of these ideas and determine
if they could be real solutions to global warming. The ins and outs of carbon - reservoirs and fluxes. The basic principles of accounting as applied to understand how carbon cycles through all the various reservoirs. One of the key things we learn from this excercise is that there are "fast" and "slow" carbon cycles. Rapid carbon cycling occurs on timescales of days to seasons to yearly timescales and is accomplished by the cycling of land and ocean life on the planet: Photosynthesis and respiration and remineralization. Changes in ocean carbon uptake and storage occur over timescales on many decades to many millennia. Even slower carbon cycling occurs over much longer timescales (millions of years) and involves the long-term processes of rock formation and weathering, as well as tectonic activity at the Earth's surface. There are several different forms of carbon that we have to keep track of in learning about the carbon cycle. The main forms are: (a) Inorganic-C in rocks (such as limestone, CaCO3); (b) organic-C (such as found in organic plant material and soils); carbon gases such as CO2, (carbon dioxide), CH4, (methane), and CO (carbon monoxide). "Carbon cycling" is really the movement of C from one of these forms to another form. An example would the plant growth, which takes carbon from the atmosphere reservoir and "fixes" it as plant-based carbon (leaves). The fundamental unit of measurement of Carbon at planetary cycling scales is the Gigaton. One gigaton is equal to one billion tons of carbon (or 10^15 g). How much is one gigaton? It is about 2750 Empire State Buildings, or about 142 million African elephants. For reference, The US carbon emission rate alone is about 1.4 gigtons per year (or about 5.4 tons/person annually). Table 1: Sizes (in
gigatons, or 10^15 g)
of the main reservoirs of carbon on earth.
Figure 1. The Global Carbon Cycle. Carbon Cycling - transferring carbon between reservoirs. There are several pathways in the carbon cycle that are of particular importance (Figure 1 above). The main pathways to and from the atmosphere are diffusion into and out of the ocean, photosynthesis which consumes CO2 from the atmosphere (an output from the atmosphere), respiration which produces CO2, and the burning of fossil fuels and biomass which produces CO2. The magnitude of these fluxes are as follows, all in 1015 g of C per year ("-" means taken from the atmosphere, "+" means given off to the atmosphere:
Mass Balance We can construct a mass balance
for the atmosphere by knowing that the amount of C in the atmosphere
increases by 3.2 x 10¹⁵ g C /yr (measured):
Given this mass balance we see that we need a "sink" of -1.8 Gt (3.2 - 5.0) to balance the global C budget. In other words, we are "missing" about 1.8 billion tons of C each year in our accounting. Where is this "missing sink"? It is believed that this missing sink is due to "land use changes", which is most probably some combination of conversion of forest to agricultural land, abandonment of agricultural land, harvest and regrowth.This continues to be a major question in global warming research. For the figure below: units are PgC. - One Pg [petagram]=one billion metric tonnes=1000 x one billion kg
Not all of the carbon reservoirs have the same response time. Specifically, some of the reservoirs are not really active participants in the global carbon cycle at human timescales, but are important over geological time scales (millions of years). For example, rocks (limestone) are by far the largest reservoir of carbon on earth, but changes in the flux of carbon to and from this reservoirs are extremely slow so that they have no real impact on changes in the gloabl carbon cycle at human timescales (10's to 1000's of years). On the other hand, changes in land and ocean productivity vary at seasonal and annual timescales and can impact global carbon cycles dramatically. The most pressing example is the dramatic rise in CO2 from fossil fuel burning (5.4 x 10¹⁵ g C / yr) and land-use changes (1.6 x 10¹⁵ g C / yr) which is increasing the atmospheric carbon reservoir at an unprecedented rate.
(A) Anthropogenic rise in CO2: CO2 concentrations have been rising for over 300 years due to human activities. The rate of increase and the magnitude of increase are believed to be unprecidented in earth history. Why was there any increase in CO2 prior to the industrial revolution in the mid-1800's? The gradual increase in atmospheric CO2 concentrations was due to forest clearing and conversion of forests to pasture lands. During this time trees were cut down, thus removing a efficient sink (remover) of carbon from the atmosphere. In addition, the trees decay over time and return the carbon to the atmosphere. Modern CO2 levels are close to 370 ppm, much higher (12%) than the preindustrial value of ~290 ppm. This increase is due to the combination of fossil fuel burning emissions and land-use changes. The average rate of CO2 increase is currently near 0.5% (~1.5 ppm/year) (how does this compare to the average population increase?).
(B). Rock weathering and volcanism: Over much longer time scales (tens of million of years) atmospheric CO2 concentrations have varied tremendously due to changes in the balance between the supply of CO2 from volcanismm and the consumption of CO2 by rock weathering. CO2 concentrations have, at times in earth history, been much higher than present or even projected future values. Over geological timescales, large (but very gradual) changes in atmospheric CO2 result from changes in this balance between rock weathering and volcanism. CO2 in the atmosphere is consumed in the weathering of rocks (CO2 combines with H2O to make carbonic acid, which slowly dissolves rocks). This weathering produces bicarbonate (HCO3-), a form of inorganic carbon, and calcium (Ca2+) that is then transported in river water to the oceans. Once in the oceans the calcium and bicarbonate are combined by organisms to form calcium carbonate, the mineral that is found in shells. This calcium carbonate mineral is buried in the sediments, where eventually it comes under great temperature and pressure and is melted during the process of "subduction". The melted rock rises to the surface in the form of magma and is released back to the surface of the earth at volcanoes. This high-temperature process also converts some of the calcium carbonate back to CO2, which is released during volcanic eruptions to the atmosphere to begin the cycle over again.
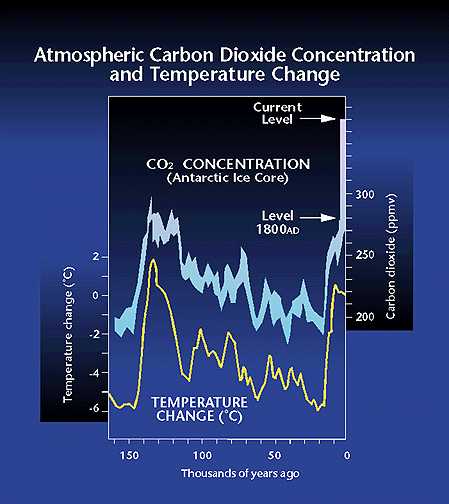
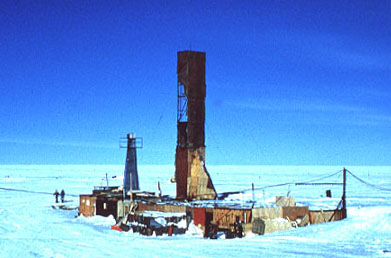
Figure 3. The global carbon cycle from the perspective of its control by weathering. We can learn about earth climate sensitivity to past variations in atmospheric CO2 by drilling into ice sheets. Ice sheets record past concentrations of atmospheric CO2 by trapping bubbles of ancient air as the ice sheet forms. The figure below shows the relationship between CO2 in the atmosphere and surface temperatures over Antarcticac spanning the last 150,000 years. As you can see, there is a very close relationship between surface temperatures and atmsopheric CO2 levels. Note, however, the present mismatch between the current high levels of CO2 (around 365 ppm) and the relatively unchanged surface temperatures. If past history is a guide to the future, the data in this plot suggest we are due for very significant global warming.
Figure 4. Relationship between CO2 in the atmosphere and surface temperature changes based on ice core drilling results from Antarctica (Vostok).
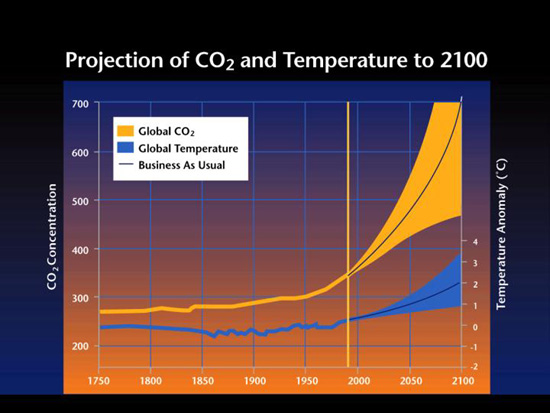
Figure 5. Projected CO2 increases in the atmosphere and estimated surface temperature changes for the next 100 years.
Updated March 29, 2004 |

