-
I want a whore car. Thanks to Hans Petter for the link.
-
Travis Reitter has been profiling gnome-terminal. The discussion is getting interesting.
Also, Paolo Borelli and others are profiling Gedit. Paolo got down to some optimizations that are possible in GtkTextView. In particular, several parts of GtkTextView have some crufty, hand-written code to get the byte offset that corresponds to a certain character position within a UTF-8 string. All those cases could be replaced with calls to g_utf8_offset_to_pointer(). That function is simply this:
gchar *
g_utf8_offset_to_pointer (const gchar *str,
                          glong        offset)
{
  const gchar *s = str;
  while (offset--)
    s = g_utf8_next_char (s);

  return (gchar *)s;
}
In turn, g_utf8_next_char() is a macro that uses a jump table to jump to the next character in a UTF-8 string:
static const gchar utf8_skip_data[256] = {
  1,1,1,1,1,1,1,1,1,1,1,1,1,1,1,1,1,1,1,1,1,1,1,1,1,1,1,1,1,1,1,1,
  1,1,1,1,1,1,1,1,1,1,1,1,1,1,1,1,1,1,1,1,1,1,1,1,1,1,1,1,1,1,1,1,
  1,1,1,1,1,1,1,1,1,1,1,1,1,1,1,1,1,1,1,1,1,1,1,1,1,1,1,1,1,1,1,1,
  1,1,1,1,1,1,1,1,1,1,1,1,1,1,1,1,1,1,1,1,1,1,1,1,1,1,1,1,1,1,1,1,
  1,1,1,1,1,1,1,1,1,1,1,1,1,1,1,1,1,1,1,1,1,1,1,1,1,1,1,1,1,1,1,1,
  1,1,1,1,1,1,1,1,1,1,1,1,1,1,1,1,1,1,1,1,1,1,1,1,1,1,1,1,1,1,1,1,
  2,2,2,2,2,2,2,2,2,2,2,2,2,2,2,2,2,2,2,2,2,2,2,2,2,2,2,2,2,2,2,2,
  3,3,3,3,3,3,3,3,3,3,3,3,3,3,3,3,4,4,4,4,4,4,4,4,5,5,5,5,6,6,1,1
};

const gchar * const g_utf8_skip = utf8_skip_data;

#define g_utf8_next_char(p) (char *)((p) + g_utf8_skip[*(guchar *)(p)])
I'm sure we could optimize g_utf8_offset_to_pointer() by doing some magic with bit arithmetic. Any takers?
-
What an idiot I am. I forgot to announce that the GNOME Foundation has hired the inimitable Shaun McCance as a contractor to write documentation for us. The document he will be writing is an Overview of the GNOME Platform. Tim Ney posted the outline for the guide.
GNOME is a big development platform, with somewhat disjoint pieces. The purpose of this overview guide is to give newcomers a quick introduction to the important parts of the platform. If you have just started programming for GNOME, and you have ever wondered, "which library do I use to do $foo", then this guide is for you.
-
A quick peek at OOCalc performance
Luis must have a lot of free time these days, since he is reading ZDnet blogs. Anyway, he linked to a post that mentions how Excel is zippy and small while loading a huge spreadsheet, and OOCalc is slow and bloated while loading the same huge spreadsheet.
Just for fun, I downloaded the spreadsheet in question and loaded it in OOCalc. Indeed, it took a couple minutes to load, and it made the OOCalc process consume about 250 MB of RAM. Here's part of that huge spreadsheet:

The spreadsheet has over 16,000 rows like that, and there are 16 similar sheets; that's over 256,000 rows with nearly identical data.
While OOCalc was loading that beast, I had Sysprof quietly monitoring the whole process.
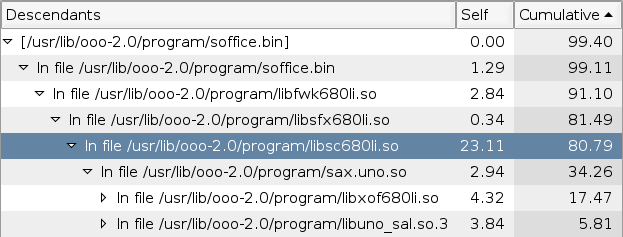
Let's see. That libsc640li.so is of course StarCalc. We spend only 23% of the time in the spreadsheet code (look at the "Self" column. I don't know what sax.uno.so is, but it and its child functions use a good 34% of the time (look at the "Cumulative" column).
Now, let's look at the memory usage. I ran this:
champignon$ pmap -x `pidof soffice.bin` | grep " rw" | grep anon | awk '{ tot += $2 } END { print tot }'
230052

champignon$ unzip -v ./200264-l.sxc
Archive:  ./200264-l.sxc
 Length   Method    Size  Ratio   Date   Time   CRC-32    Name
--------  ------  ------- -----   ----   ----   ------    ----
      28  Stored       28   0%  09-14-05 06:17  9413bc45  mimetype
293059603  Defl:N  3765082  99%  09-14-05 06:17  47318271  content.xml
   25234  Defl:N     2394  91%  09-14-05 06:17  ada8042a  styles.xml
    1102  Stored     1102   0%  09-14-05 06:17  b411d0da  meta.xml
   23926  Defl:N     1376  94%  09-14-05 06:17  95ea405a  settings.xml
     750  Defl:N      252  66%  09-14-05 06:17  5313cb53  META-INF/manifest.xml
--------          -------  ---                            -------
293110643          3770234  99%                            6 files
The first 230052 KB is the heap of OpenOffice. Note that it is very close to the 293 MB of the uncompressed XML data for the entire spreadsheet.
The ZDnet guy mentions that Excel uses about 34 MB to hold the spreadsheet. That's an order of magnitude larger than the 3.7 MB of the compressed XML — quite typical, I'd say, for exploding a data structure into memory.
That spreadsheet has many duplicated strings: just look at the first screenshot. I wonder if Excel stores a single copy of each string, plus a reference count, while OOCalc just keeps N copies of the string. That's a semi-trivial optimization one could make in OOCalc.
I was extremely pleased to see that Sysprof handled this without any trouble whatsoever. My regular benchmarks for Pango give about 10,000 samples in Sysprof; OOCalc generated around 90,000 samples and Sysprof didn't even blink.
Now it is up to the OOo hackers to build the culprit sub-modules with debug information and re-run the Sysprof test. That will give a real call trace instead of just the tree of libfoo.so.
-
Ha Shao and Greg Aumann kindly pointed me to a fantastic list of character frequencies for modern Chinese. That site on Chinese computing is totally awesome. It even gives you the most common bigrams!
The frequency lists are especially interesting. It's funny that both gentlemen who mailed me pointed out exactly the same thing: a cache with about 1100 entries will fit the 90th percentile of the most frequent characters in Chinese. This is not really much bigger than our current cache of 256 entries; even if we grew it to 2048 entries, the cache would only use 16 KB of memory. Sergio Costas also pointed out that in a 256-element cache, we could even shrink each entry by one byte, as that information is redundant with the index used for table lookup
It would be interesting to know the frequencies of characters for our Chinese/Japanese/Korean translations. Does anyone want to cook a script to do that? The corpus of GNOME translations is in the pango-profile module on CVS.
-
Oh, yes, the pango-profile module. I've started it to have a central place to put our patches-in-progress. So, if you have a patch for Pango to improve performance, please upload it there and post an analysis somewhere. You can also use the benchmark and plotting programs there to see what effect your patch has on all the GNOME translations.
-
Last night we had a little hack-a-thon in irc.gimp.org's #performance. Billy Biggs did some Pango profiling and he managed to kill another 5.58% of the time spent in Pango. I managed to kill around 7.44% within the shaping process; I'll post the details on that soon. I'm glad that the updated benchmark program is being useful to other people.
-
Interpreting Sysprof results: Gedit's "replace all"
Luis Menina mailed me and asked about how to interpret some results he got out of Sysprof. He is working on speeding up Gedit's "replace all" functionality, which is very slow right now. That bug has an attachment with a Sysprof log. So, I loaded that log into Sysprof to take a look.

The code in gedit_document_replace_all() basically does this:
gboolean
gedit_document_replace_all (GeditDocument *doc,
			    const gchar *find, const gchar *replace,
			    gint flags)
{
	/* ... */

	while (gedit_document_find (doc, find, flags))
	{
		gedit_document_replace_selected_text (doc, replace);

		GEDIT_SEARCH_SET_FROM_CURSOR (flags, TRUE);
	}
}
If we look at the code for gedit_document_find(), we see basically this:
gboolean
gedit_document_find (GeditDocument* doc, const gchar* str, gint flags)
{
	/* ... find the string ... */

	/* Tell the GUI to update itself */
	g_signal_emit (G_OBJECT (doc), document_signals[CAN_FIND_AGAIN], 0);
}
So, who handles the "can-find-again" signal? We see that it is gedit_mdi_child_document_can_find_again_handler(). Let's look at the source for that:
static void
gedit_mdi_child_document_can_find_again_handler (GeditDocument *document, GeditMDIChild* child)
{
	/* ... */

	g_signal_emit (G_OBJECT (child), mdi_child_signals [FIND_STATE_CHANGED], 0);
}
Finally, let's look at the handler for that "find-state-changed" signal:
static void
gedit_mdi_child_find_state_changed_handler (GeditMDIChild *child)
{
	/* ... */

	gedit_mdi_set_active_window_find_verbs_sensitivity (BONOBO_MDI (gedit_mdi));
}
Aha! So our initial "can-find-again" signal is being used in the upstream code to know when to update the GUI: when you do Search/Find in Gedit, it will turn on its "Find Previous" and "Find Next" menu items to indicate that there are more matches available. Let's look at that bad boy:
static void
gedit_mdi_set_active_window_find_verbs_sensitivity (BonoboMDI *mdi)
{
	gboolean sensitive;

	sensitive = gedit_document_can_find_again (doc);

	bonobo_ui_component_freeze (ui_component, NULL);

	gedit_menus_set_verb_sensitive (ui_component, "/commands/SearchFindNext",
					sensitive);

	gedit_menus_set_verb_sensitive (ui_component, "/commands/SearchFindPrev",
					sensitive);

	bonobo_ui_component_thaw (ui_component, NULL);
}
At the end of that function is the bonobo_ui_component_thaw() which shows up highlighted in the Sysprof screenshot above.
Now we can see the big picture:
-
"Replace all" calls gedit_document_find() many times.
-
When gedit_document_find() does its work, it emits a signal that the GUI code uses to update the sensitivity of menu items.
-
The GUI code changes the sensitivity of a couple menu items. It does this by asking the BonoboUIComponent to freeze itself, then changing the sensitivity, then thawing the component. Bonobo then updates the widgets that correspond to menu items with pending changes.
The problem is that (3) happens for every match in the "replace all" process! The solution is to update the GUI only once, when the whole process has finished.
-
-
Profiling the file chooser, part 8: a global benchmark for Pango
My last benchmark was about taking a bunch of strings for many languages, measuring them, and plotting the results of the timings. The resulting chart simply compared the average time to measure a string in each language, which is not very useful information. Yes, Arabic is going to be slower than Spanish, since it has to do shaping. Also, different languages need a different number of characters to say the same thing. So, a chart that simply compares the base timings for all languages is not useful. So what can we do?
Optimizations in different parts of Pango will have different effects depending on which language you are using. For example, the initial optimization to map characters to scripts does not improve far-Eastern languages at all, since it only works for Unicode characters below U+2000; Chinese/Japanese/Korean characters are above that point.
So, we need a way to see how each individual optimization will help or harm each language. You want per-language timings before applying an optimization patch, and per-language timings after the patch.
I modified my timing program accordingly, and the plotting program so that it will present a comparison of each patch's timings. The results are interesting:
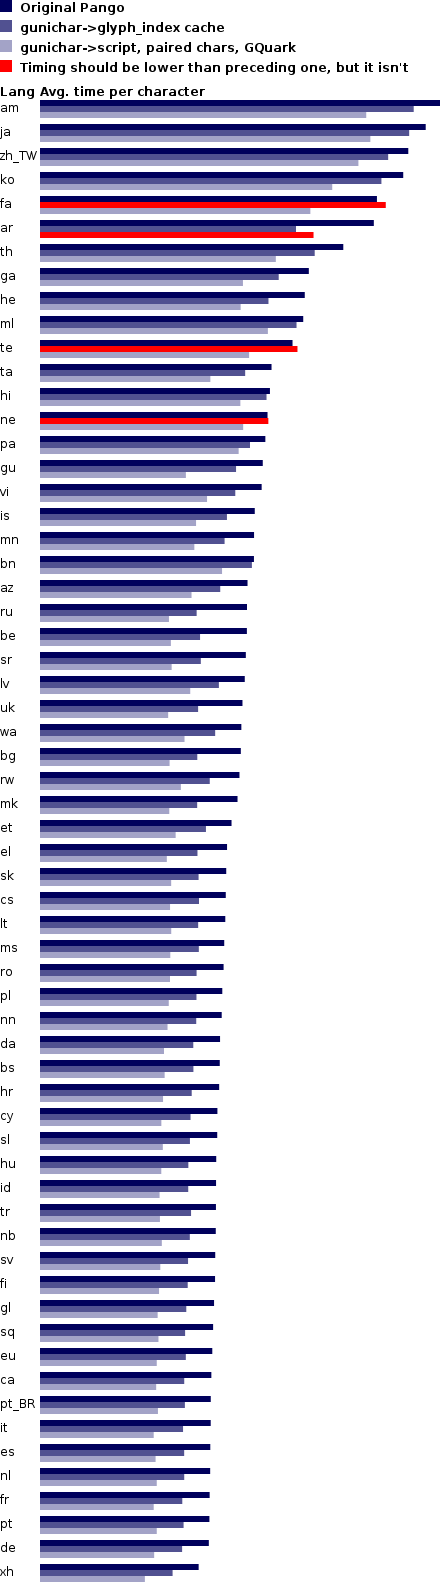
As you can see, each language has three timings: one for an unmodified Pango, one with the patch for the gunichar->glyph_index cache, and one for the lookup tables for gunichar->script and paired characters. In theory every subsequent patch should improve things for all languages, i.e. make the bars shorter. The red bars indicate where this is not the case, and so it means that a patch has unexpected behavior. We need to fix those cases.
How you can run the benchmark yourself
-
mkdir ~/pango-benchmark; cd ~/pango-benchmark
-
Download po-data.tar.bz2 (warning: 15 MB file). Unpack it; it will create a directory called pango-benchmark/po-data, full of .dat files.
-
Download pango-language-profile.c; compile it.
-
Download plot-languages.py.
-
Benchmark your original Pango:
./pango-language-profile -o test1.xml -n "Name of first test" -
Patch your Pango, and run a second benchmark:
./pango-language-profile -o test2.xml -n "Name of second test" -
Patch your Pango again, and run a third benchmark:
./pango-language-profile -o test3.xml -n "Name of third test" -
Once you have all the results you need, make a plot:
python ./plot-languages.py -o chart.png test1.xml test2.xml test3.xml -
Think on how to improve things, make a new patch, and go back to step 7.
-
-
It looks like someone moved into the Lucky Cave.
-
Performance-related articles from Red Hat Magazine:
- Compiler options (Diego Novillo)
- Profiling tools (Diego Novillo)
- Using Oprofile to see why Mozilla builds slowly (Will Cohen)
-
Billy Biggs has an introduction on making Oprofile produce understandable results.
-
One of Microsoft's performance experts has a great blog post about 5% performance wins in a mature product, versus huge wins that come from fixing stupid things in an immature product, or in one with a broken development process.
Happily, Pango is in the first category: we've veen chopping off small percentages.
Most of the slow parts in GNOME, however, are in the second category. Our development process doesn't have any way to test for regressions in performance. We need a way to know when things become slower than they used to be; once we have that, we can know why they became slower (did someone inadvertently plug a quadratic algorithm deep down in the platform? Did we start scanning hundreds of scattered files all over the disk again?).
During the Boston Summit, we talked about ways of having a way to test for regressions in performance. If we had a continuously-running tinderbox (or any other automated compile-the-whole-platform system), we could also make it run our performance benchmarks after each compilation. It would tell us "after yesterday's commits, operation Foo in the desktop became 30% slower".
-
Joe gets pain as a user, as a result of the painful world of Linux ISVs.
One-size-fits-all RPMs that don't work? That's because distros install stuff wherever they damn well please.
Oh, and as we all know, distros have different package-management systems. Who has the resources to support that?
No .desktop file? Where would they put it? There are vendors who even have the panache of overriding the default .desktop files, so there's even a smaller chance than usual of getting things right.
Build a kernel module? If the kernel had a stable ABI, you wouldn't have to do this. But they change it every equinox, because it's fun and good for free software, or something.
-
Profiling the file chooser, part 7: quantifying the behavior of the glyph cache
Benchmark results: little apps
These are the results for my benchmark:
Maximum number of PangoCairoFcFont objects: 56
Maximum number of glyph caches created: 2 (4 KB)
Glyph cache hits: 24679027
Glyph cache misses: 89
Glyph cache miss rate: 0.000361%
So, out of 24.7 million lookups, we only missed 89 times! Also, we only use 4 KB of memory for the glyph caches (each cache is exactly 2 KB). Not bad, but the benchmark is rather contrived: it just measures and re-measures the same strings all the time, in the same font. My strings are all English or Spanish, so they all fit within the Latin-1 subspace in Unicode, which is reasonably small. The cache gets populated as the first few strings come in; afterwards, it already has everything it will ever need to look up.
Also, the benchmark measures a shitload of text, namely 24.7 million characters. Ulysses has only 1.5 million characters (count 'em).
Gedit results
Next, I ran Gedit, loaded a few source files, scrolled up and down in them a few times, opened a few dialogs, and generally fooled with the program for a bit. When Gedit exits, it prints these results:
Maximum number of PangoCairoFcFont objects: 181
Maximum number of glyph caches created: 7 (14 KB)
Glyph cache hits: 339988
Glyph cache misses: 268
Glyph cache miss rate: 0.078764%
There are more font objects because unlike my benchmark, Gedit does use more font descriptions: the one for "normal" text in the GUI, the one for bold text in the primary message of dialog boxes, a smaller one for the secondary message in dialogs, one for the text area, etc. Only 7 of these font objects get caches created for them, so we only use 14 KB for the caches. Finally, Gedit doesn't measure text like crazy; it just sits idle most of the time waiting for you to type something. It does about 340,000 lookups in the cache, and gets only 268 misses. Again, these cache misses happen for the first few strings that get used for each font.
Note that 340,000 lookups is two orders of magnitude smaller than the 24 million from the benchmark. No wonder the miss rate is bigger, but even then it is still less than 0.1%.
I can't tell you if Gedit really scrolls faster than before; it happens too fast to tell by eye (even before the patch, I couldn't see any lag when scrolling around in Gedit). Maybe such a test makes more sense on a small device like the Nokia 770.
Gucharmap results
So, what would use a boatload of fonts that truly get accessed? Why, Gucharmap, of course.
I ran Gucharmap, switched to the view by Unicode block, and clicked once on each block; this makes the block be displayed and its corresponding font be accesed. The results are pretty encouraging:
Maximum number of PangoCairoFcFont objects: 182
Maximum number of glyph caches created: 40 (80 KB)
Glyph cache hits: 115138
Glyph cache misses: 4266
Glyph cache miss rate: 3.572745%
We only access 40 font objects throughout the whole process. I of course don't have font files to cover all of Unicode, and that's why many characters in Gucharmap get displayed as empty. But still, these results indicate that even a font-happy app like Gucharmap doesn't get bogged down in caches or anything.
Benchmarking all languages
But let's go back to Behdad's question. We need to know how the cache performs for all languages. I took Roozbeh's script to download many interesting .po files, and ran the resulting .po files through a script to make them easy to digest by a program. This script basically takes all the translations for a particular language, and puts them in a file, separated by null characters.
I then modified the Pango benchmark to process these raw files of strings. With the modified Pango patch to print cache statistics, I was able to get a bunch of results. I used another script to tabulate the results into a format palatable to OpenOffice's CSV importer.
The raw table of results is here.
... And then, I spent the entire morning fighting OpenOffice and Gnumeric to produce a sane chart out of that data, and failed miserably. So I wrote my own plotting program with pycairo.
My plotting program ignores languages which had less than 400,000 translated strings — those looked like rather incomplete translations, since the majority of the language sets had more strings that. The languages that got removed are af, ang, as, az_IR, br, eo, hy, ia, ka, kn, ku, li, mi, mr, nso, or, tg, tk, tl, ug, uz, yi, yo, zu.
The plotting program sorts the results by execution time and plots them against their cache misses/hits:

Some notes about this:
Each language set has a different number of strings in it. A better benchmark would use translations for the same strings. For this, I take (total_execution_time ÷ num_strings) for each language and use that to plot the time bars. Maybe it would be better to use (total_execution_time ÷ num_characters), but I'm not sure — what if a language requires in general more characters for strings that mean the same as in another language?
The little graphs of cache hits/misses are in a logarithmic scale; cache hits are green, misses are red. The language with the biggest cache miss rate is ko, with a miss rate of 18.32%. And the smallest miss rate is xh, with 0.0009%. The log scale goes from 0.0009% (all green) to 18.32% (all red).
Open questions
I need to redraw that chart to show both the time-before-cache and time-after-cache patches.
Arabic is the slowest language, probably due to the shaping. But who really knows; I don't have a profile of just that language.
Why are am and ga so much faster than, say, Spanish (es)? Is it a bug in the benchmark?
-
Roozbeh kindly responded to my call for a tool to gather all the translated strings for a particular language. Soon I'll be plugging this into my Pango benchmark so that we can track performance for each of the languages we support.
I'm getting more and more convinced that fully optimizing Pango will require cooperation from hackers around the world, especially hackers who natively use non-Latin scripts. For example, I have no idea of the common usage cases for Arabic or Japanese. And while optimizing the Thai shaper would certainly be an interesting intellectual exercise, I have no way to ensure that I'm doing the right thing. So, if you care about your native language, step up and profile it!
-
Profiling the file chooser, part 6: Pango gunichar->script and paired character mappings
Yesterday I got a lot of help from the Cairo/Fontconfig experts. Today I spent most of the day with Billy Biggs and Owen Taylor, so that we could profile the innards of Pango. Just like yesterday, we ran repeated tests and fixed the top time consumers.
Mapping Unicode characters to scripts
Pango has to look at each character in your strings and compute which script corresponds to that character. For example, 'a' corresponds to Latin, 'θ' corresponds to Greek, etc. Pango has a table that maps Unicode ranges to scripts. For example, the table says that the Unicode points U+0041 to U+005a inclusive correspond to Latin, since those are the uppercase letters 'A' to 'Z'.
static const struct {
    gunichar    start;
    guint16     chars;
    guint16     script;		/* PangoScript */
} pango_script_table[] = {
 { 0x0041,    26, PANGO_SCRIPT_LATIN },        /* uppercase A-Z */
 { 0x0061,    26, PANGO_SCRIPT_LATIN },        /* lowercase a-z */
 { 0x00aa,     1, PANGO_SCRIPT_LATIN },
 { 0x00ba,     1, PANGO_SCRIPT_LATIN },
 { 0x00c0,    23, PANGO_SCRIPT_LATIN },        /* uppercase Latin letters with diacritics */
 { 0x00d8,    31, PANGO_SCRIPT_LATIN },        /* some more of those, plus lowercase */
 ...
 { 0x1d1aa,     4, PANGO_SCRIPT_INHERITED },
 { 0x1d200,    70, PANGO_SCRIPT_GREEK },
 { 0x20000, 42711, PANGO_SCRIPT_HAN },         /* huge Oriental scripts */
 { 0x2f800,   542, PANGO_SCRIPT_HAN },
 { 0xe0100,   240, PANGO_SCRIPT_INHERITED },
};
For each character, Pango would simply do a binary search on this table. That was taking up about 7.8% of the total time. First, Billy and I thought that it would be pretty simple to fix. We would simply cache the last lookup index within the table, since it is likely that a character will be in the same script as the preceding character. However, this wasn't much of an improvement. The Latin script is rather spread out over the first few thousand code points in Unicode; we were getting misses on every whitespace, punctuation, or switch from uppercase to lowercase.
Billy then suggested that we could simply use a new lookup table that directly maps the first few thousand Unicode characters to their corresponding scripts. That table only needs one byte per entry, since there are only actually about 60 scripts in Pango (actually, you need less than one byte per entry, but let's assume that one byte is the smallest unit that you can use comfortably). So, we wrote a tiny program to compute that table, spit it in a header file, and #include it in the Pango code.
That table of course doesn't cover the whole Unicode space. That would be a huge table, since Unicode has more than 100,000 code points. In our table, we just cover the first 8192 characters — at one byte per entry, that's exactly 8 KB of memory which is shared across all processes, and is read-only. This lookup table works extremely well for the scripts within the first 8192 characters in Unicode: Latin, Greek, Cyrillic, Armenian, Hebrew, Arabic, Bengali, and others — basically, everything but symbols (arrows, dingbats) and CJK scripts.
#define PANGO_EASY_SCRIPTS_RANGE 8192
static const guchar pango_easy_scripts_table[] = {
  PANGO_SCRIPT_COMMON,
  PANGO_SCRIPT_COMMON,
  PANGO_SCRIPT_COMMON,
  ...
  PANGO_SCRIPT_COMMON,
  PANGO_SCRIPT_COMMON | (1 << 7), /* these two are parentheses */
  PANGO_SCRIPT_COMMON | (1 << 7),
  PANGO_SCRIPT_COMMON,
  ...
  PANGO_SCRIPT_LATIN,
  PANGO_SCRIPT_LATIN,
  PANGO_SCRIPT_LATIN,
  ...
  PANGO_SCRIPT_GREEK,
  PANGO_SCRIPT_GREEK,
  PANGO_SCRIPT_GREEK,
  PANGO_SCRIPT_COMMON,
};
The table made the gunichar->script mapping basically free. After taking new profiles, we saw that the next consumer of time was about figuring out paired characters.
Paired characters

In Unicode, paired characters are those that have a left and a right version. Some of these are '()', '<>', '[]', '{}', '«»'. Pango neds to know if a particular character is a paired character, so that it can keep track of some complicated nesting rules defined by the Unicode standard.
To know if a character is a paired character, Pango has another little lookup table (look for "paired_chars" in pango-script.c); it would simply do a binary search on that table. That is the get_pair_index() function highlighted in the Sysprof screenshot above. The lookup table is really skewed toward the high code points:
static const gunichar paired_chars[] = {
  0x0028, 0x0029, /* ascii paired punctuation */
  0x003c, 0x003e,
  0x005b, 0x005d,
  0x007b, 0x007d,
  0x00ab, 0x00bb, /* guillemets */
  /***** big gap here; notice the skew towards code points above 0x2000 and 0x3000 *****/
  0x2018, 0x2019, /* general punctuation */
  0x201c, 0x201d,
  0x2039, 0x203a,
  0x3008, 0x3009, /* chinese paired punctuation */
  0x300a, 0x300b,
  0x300c, 0x300d,
  0x300e, 0x300f,
  0x3010, 0x3011,
  0x3014, 0x3015,
  0x3016, 0x3017,
  0x3018, 0x3019,
  0x301a, 0x301b
};
At first we thought of splitting this table into two: a tiny one for code points below 8192 (0x2000), and another one for the high code points. But then we figured out that we can instead use the upper bit of each entry in our lookup table for the gunichar->scripts (the one I described above). Since the numbers that we store in that table are small — 0 through 62, which is the number of scripts in Pango — the upper bit is free for us to use. So we modified the program that computes the lookup table, and put the new table into the code.
With this second change, the profile now shows that we killed that 5.28% from get_pair_index(), and the lookup is basically free for everything within the first 8192 code points (again, all of Latin, Greek, Cyrillic, etc.).
Using GQuark instead of plain strings
The last, super-tiny change was to replace one usage of g_object_set/get_data() which was showing up in the profile, by the cheaper g_object_get/set_qdata(). If you'll be doing object data lookups very frequently, you should intern and use a GQuark rather than using plain strings.
Results of the day
The following image shows the top of the profile before making the changes; all those changes were in functions called directly or indirectly by pango_script_iter_new(). Note how this function would take 15.11% of the total running time:

After making the three changes described above (gunichar->script lookup table, paired characters, GQuark), we reduced that 15.11% down to 2.94%:
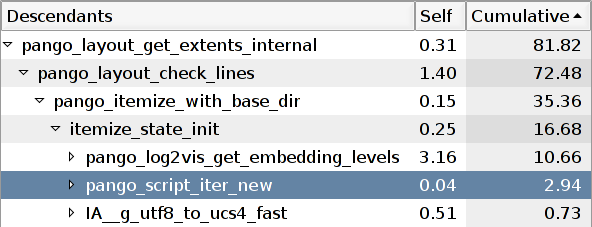
Notice how making that function fast made the top time consumer be another function. Look above the highlighted row: now, it is pango_log2vis_get_embedding_levels() that is taking up 10.66% of the new running time. This is mostly time spent inside Fribidi, which is responsible for figuring out which parts of a string are in a left-to-right language, and which are in a right-to-left one.
We went to a coffee shop, and while Billy and I kept analyzing other parts of the profile, Owen fixed the Fribidi stuff. He totally killed it for strings which are all left-to-right or right-to-left; the slow case will only happen for strings with mixed directions. I hope Owen blogs a detailed description of his changes :)
Just like yesterday, we measured the CPU time of the benchmark with /usr/bin/time to track our progress. I added another column to the graph from yesterday. The shortest bar, on the right, is today's results. This is the new scoreboard, without Owen's changes:

In total, we have managed to kill around 24% of the original running time. Not bad for two days of work on a seemingly-intractable flat profile!
The patch is here if you want to play with it. Like yesterday's patch, it still needs a few cleanups before it can go into CVS. It would be great if people on CJK locales could run it; it shouldn't change their performance.
-
Profiling the file chooser, part 5: Pango glyph lookups
Like I mentioned the last time, my latest profiles for the file chooser indicate that for resonably-sized folders, it spends most of its time measuring text. I started dissecting GtkTreeView, and found that GtkCellRendererText measures things more often than necessary. But ultimately it boils down to the fact that we spend a good amount of time in Pango. So, I've diverged a bit from profiling the file chooser and gone into trying to make Pango faster.
Today I spent the entire morning seated beside Carl Worth and Keith Packard, showing them my profiles and probing their brains about how the interactions between Pango and Cairo/Fontconfig/Freetype could be made faster. We discovered some pretty interesting stuff. We basically went through each of the top time consumers in the profiles I've been taking, and we saw what those functions were doing.
As it turns out, Pango is very well optimized already. Owen really did his homework — there is no single largest time consumer, and the profile shows up flat. This probably means that we either need to micro-optimize, or look into better ways of doing things.
By going through the profile and looking at the relevant code, and taking into account how Pango is supposed to work, we got some interesting results. There are a few places in Pango that may benefit from simple, small caches with an eviction policy — sadly, many "caches" in GNOME are just hash tables where we stuff computed results, but nothing gets ever removed from them. They just grow and grow over time. I guess the profiling and memory reduction effort will eventually find those cases so that we can fix them.
One place in Pango that could benefit from a little cache is where Pango takes a Unicode code point ("A" = U+0041, LATIN CAPITAL LETTER A) and a scaled font, and finds the glyph index that corresponds to that character within that font ("glyph index 7 in some-latin-font.ttf"). Currently, that operation is rather expensive — Pango spends about 15% of its time acquiring the scaled font from Cairo/Fontconfig and doing the lookup.
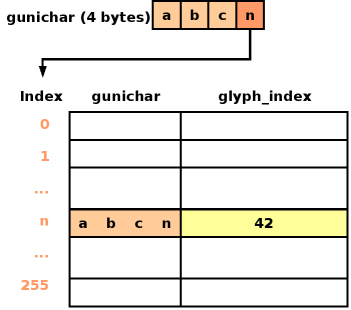
So, I added a per-font, fixed-size cache that only exists if you ever look up a glyph in that particular font (most of the time there are many loaded fonts, so as to cover the whole Unicode space, but you only access a few of them for your particular language's region). The cache is a table with 256 entries. Each Unicode point ("gunichar" in Glib parlance) is 4 bytes. I use the lowest-order byte from each gunichar as an index into the 256-element table. Each table element is a <gunichar, glyph_index> pair. To do a lookup, we take the lowest-order byte of the gunichar and use it as an index in the table. That cache entry is valid if the gunichar in question is the same as the gunichar stored in the first column; if so, then the glyph index will be in the second column. If the gunichar doesn't match with the one stored at that position in the table, we simply do the full lookup against Cairo/Fontconfig; we also update the table row by discarding its old info and replacing it with the new <gunichar, glyph_index> pair.
This is similar to the way a processor's memory cache works. To see if the cache has the data for a particular memory address, the processor takes the lowest-order bits of the address in question, and uses that as an index into a table. Each table entry holds the complete memory addres and the data that is stored at that address. Each row also holds an extra bit that indicates whether that entry is valid. In Pango we don't need an extra bit per row: if the gunichar column inside a row is 0, we know that the row is invalid, as 0 is not a valid Unicode point.
I still need to get real timings to see if the cache makes any difference in the final running time of applications. But from doing an initial profile, I can see that Pango originally took about 16% of its time in doing the gunichar->glyph_index mappings; after making the changes above, the mappings only take up about 4% of the profile.
By the way, the patch to add the cache is here: pango-gunichar-to-glyph-index.diff.
-
Update: Yesterday I was having a lot of trouble getting meaningful timings from my little Pango benchmark. It is a program that has a list of all the file names directly under my home directory. The program first creates a dummy dialog box and shows it, so that Pango's font machinery will have a chance to initialize itself — for now, I do not want to include bootstrap time into my benchmark. Then, the program creates a dummy window, and uses it to create a bunch of PangoLayouts. It sets each layout to a different string from the list of file names, and measures the string with pango_layout_get_extents(). The program iterates through the whole list of file names a bunch of times so that it will take several seconds to finish.
Up to now I was using 100 iterations, which led to a running time of about 7 seconds on my laptop. But I was always getting timings with large deviations: sometimes the test would take about 6.5 seconds; other times it would take close to 8 seconds. Obviously, the other running processes on my machine were affecting it a lot.
By simply increasing the number of iterations to 1000, I can now get pretty consistent results. And so, the scoreboard:

That is, from 77.42 seconds before the patch to 68.80 seconds after the patch. Not an earth-shattering improvement, but it's a good start.
-
Help needed: On my benchmark, the cache appears to be good for Latin text. I have not run a real program with it to see if it makes a difference, mainly because I have no good way of timing a whole program. Still, I have no idea if the cache is beneficial for scripts which have a lot of code points (CJK, anyone?).
Your mission, should you decide to accept it, is to grab the benchmark program and the patch for Pango, and then do this:
-
Grab all the .po files for GNOME from cvs.gnome.org. Or at least, grab a good number of them.
-
Gather all the translated strings for each language in a separate file. You'll end up with one file for all the Spanish translations, one file for all the Japanese translations, one file for all the Hebrew translations, etc. Strip all the msgid gunk and the comments; we just want the translated text in each file.
-
Hack the benchmark program so that you can make it load one of those language files completely in memory, split it into lines, and then run a loop a few thousand times measuring all the strings for that language.
-
Take timings before and after applying the Pango patch. The best way to take timings is to run /usr/bin/time ./pango-layout-profile, and take the "user time" value — that's the time spent in the CPU.
Hacking the Pango patch to keep a count of cache hits/misses (look at the #ifdefs in it) is pretty simple, and for English text I get a fantastic hit rate. It may be that the patch is not so good for languages with lots of code points, like CJK scripts. But we need real numbers first. Any takers?
-
-
My presentation from the GNOME Summit is here:

You can also get the original .odp file.
-
Duncan pointed me yesterday to "Sparklines", a sample chapter from Edward Tufte's upcoming book. It is just beautiful. We could use sparklines in Evolution's folder tree to show per-folder time histograms of number of incoming mails, number of unread mails, average depth of threads, etc. That would let you know, by eyeballing the folder tree, that some mailing list has an interesting flame war going on and that you haven't read.
-
As further proof that the world is getting more fucked up, the port of Veracruz is flooded, while the weather in Boston is just gorgeous. I never knew that could happen.
-
You know how in GtkTreeView, when rows get inserted above the topmost visible row, the alternating row colors flip around all the time, leading to massive visual confusion? Hans Petter is adding parity tracking to GtkTreeView so that this annoyance won't happen.
-
MIT:


-
I've just hoarded a slot in the first day of the Summit's schedule; I'll give a little talk on profiling GNOME (tools, techniques, status of GNOME performance, some hot spots). I don't think it will teach anything new to most people, but at least it will encourage hackers to gather the few tools that we have and start profiling things. It would be perfect if we could profile a bunch of hot spots during the Summit, present our findings on the last day, and then fix the actual problems over the next few months.
So, mark it on your calendar! Saturday, 11:45 - Profiling GNOME.
-
I turned up the volume on my laptop while it was playing music through the speaker. The microphone was unmuted inadvertently, and it got into a nice and uniform feedback loop. Awesome.
-
Profiling the file chooser, part 4: inside GtkTreeView
After taking profiles after making the previous fixes, it turns out that the thing that's taking up the largest amount of time in the file chooser is measuring text inside GtkTreeView. That's a pretty complicated piece of code, and I've been dissecting it slowly.
What does "measuring text" mean? It means creating a PangoLayout, setting its various properties, and then doing something which causes pango_layout_get_extents() to be called. This function does all the interesting work in Pango: it is the function that splits your strings into glyphs, computes the glyph sizes, adds them up, and gives you the total size of the string in pixels.
Ideally, that operation should happen only once for each string that you put on the screen. You can set any number of properties on a PangoLayout and then call pango_layout_get_extents(). That function makes the layout remember the result of splitting your string into chunks that make sense to Pango — that splitting operation is actually the most expensive part of the measuring process. If you then call pango_layout_get_extents() again on your layout, it will only traverse those cached results and add up the glyph sizes again; that is a much cheaper operation.
However, if you call pango_layout_get_extents(), and then change some properties in the layout, and call pango_layout_get_extents() again, you'll cause a full re-split and re-measure to happen. This is because your property changes could have caused the layout to change its size.
As it turns out, GtkCellRendererText causes that re-split and re-measure to happen in various situations, especially when the cell is configured to use ellipsized text — where you display "A very long str..." instead of "A very long string that doesn't fit". The file chooser uses ellipsed cells for the file name column, so this re-split and re-measure happens all the time. I've been working on finding a way to measure strings as few times as possible.
So, first I patched pango_layout_get_extents() to keep the total time spent there. This function actually does two things:
pango_layout_get_extents ()
{
    split_into_lines();
    add_up_line_extents();
    return sum_of_extents;
}
The split_into_lines() bit is the expensive part; that's actually pango_layout_check_lines(). It is also the part that remembers its results across invocations, so that it doesn't have to recompute them if the layout hasn't changed. The add_up_line_extents() bit is much less expensive. If I bring up the file chooser to show my $HOME, the timings are like this:
Number of calls Total time Average time per call Splitting text into lines 925 0.367 sec 0.000396 sec Adding up the measurements 971 0.021 sec 0.000021 sec 367 milliseconds spent splitting text into lines is bad for the file chooser; it's more than the total 100 milliseconds I want to spend bringing up the chooser. Then again, 21 milliseconds adding up the measurements is probably not terrible. There is a open bug about caching the sums; I don't know if that's really worthwhile.
This does not take into account measuring the first string that gets measured in the program. That takes a long time (around an extra 0.3 seconds) because fontconfig has to read its configuration files.
So I guess I'll be looking into optimizing PangoLayout next.