|
Contents
Major Findings
Research Methodology
Russian Regions
The Activity of Internet Usage
The Internet access places
Internet expansion reserves
The structure of Internet users: Gender
The structure of Internet users: Age
The structure of Internet users: Education
The structure of Internet users: Income
Reference
1. Major Findings (See http://www.fom.ru/projects/23.htm)
|
Those used the Internet at least in the last: |
|
six months
(six months audience)
We call them
»the Internet users» |
three months
(three months audience) |
month
(monthly
audience) |
week
(weekly
audience) |
24 hrs
(daily
audience) |
|
% |
million
people |
% |
million
people |
% |
million
people |
% |
million
people |
% |
million people |
| Fall 2002 |
8 |
8,7 |
7 |
7,6 |
6 |
6,5 |
4 |
4,6 |
2 |
2,1 |
| Winter 2002-2003 |
9 |
9,6 |
8 |
8,7 |
7 |
7,7 |
5 |
5,5 |
3 |
2,8 |
| Spring 2003 |
10 |
11,5 |
9 |
10,5 |
8 |
8,9 |
6 |
6,4 |
3 |
3,2 |
| Summer 2003 |
11 |
12,1 |
10 |
10,8 |
8 |
9,0 |
6 |
6,1 |
3 |
3,0 |
| Fall 2003 |
12 |
13,1 |
10 |
11,6 |
9 |
9,9 |
6 |
6,9 |
3 |
3,2 |
| Winter 2003-2004 |
13 |
14,6 |
12 |
13,3 |
10 |
11,6 |
7 |
8,2 |
3 |
3,8 |
| Spring 2004 |
14 |
14,9 |
12 |
13,7 |
11 |
12,0 |
8 |
8,5 |
4 |
3,3 |
| Summer 2004 |
15 |
16,9 |
14 |
15,5 |
12 |
13,4 |
9 |
9,5 |
5 |
5,0 |
| Fall 2004 |
16 |
17,3 |
14 |
15,7 |
12 |
13,7 |
9 |
10,1 |
5 |
5,5 |
| Winter 2004-2005 |
16 |
17,6 |
15 |
16,0 |
13 |
14,2 |
9 |
10,3 |
5 |
5,2 |
| Spring 2005 |
17 |
18,9 |
16 |
17,5 |
14 |
15,5 |
10 |
11,0 |
5 |
5,7 |
| Summer 2005 |
19 |
20,9 |
17 |
18,9 |
15 |
16,1 |
10 |
11,2 |
5 |
5,9 |
| Fall 2005 |
20 |
21,7 |
18 |
19,7 |
16 |
17,5 |
12 |
12,9 |
6 |
6,8 |
| Winter 2005-2006 |
21 |
23,8 |
20 |
22,2 |
18 |
20,1 |
13 |
15,1 |
7 |
8,0 |
| Spring 2006 |
21 |
24,3 |
20 |
22,7 |
18 |
20,6 |
14 |
15,6 |
7 |
8,5 |
| Summer 2006 |
23 |
26,0 |
21 |
24,2 |
19 |
21,4 |
14 |
16,0 |
8 |
9,1 |
| Fall 2006 |
23 |
26,3 |
21 |
24,4 |
19 |
21,9 |
15 |
17,0 |
8 |
9,5 |
| Çèìà 2006-2007 |
25 |
28,0 |
23 |
26,3 |
21 |
23,9 |
16 |
18,4 |
9 |
10,1 |
| Difference Fall - Winter |
2 |
1,7 |
2 |
1,9 |
2 |
2,0 |
1 |
1,4 |
1 |
0,6 |
gr.1
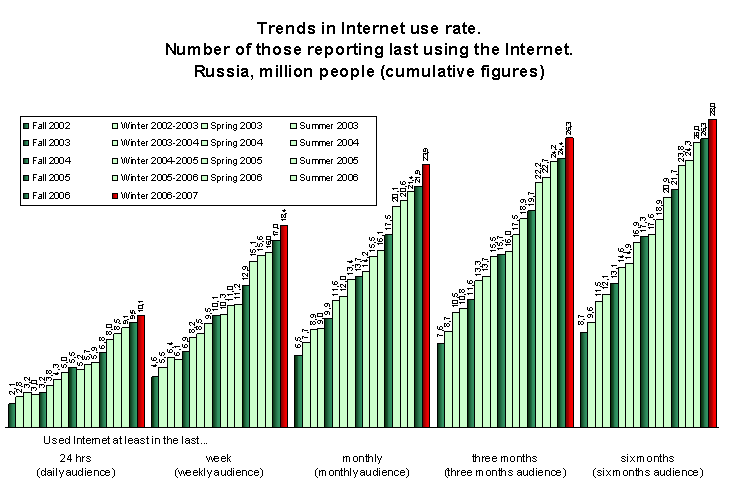
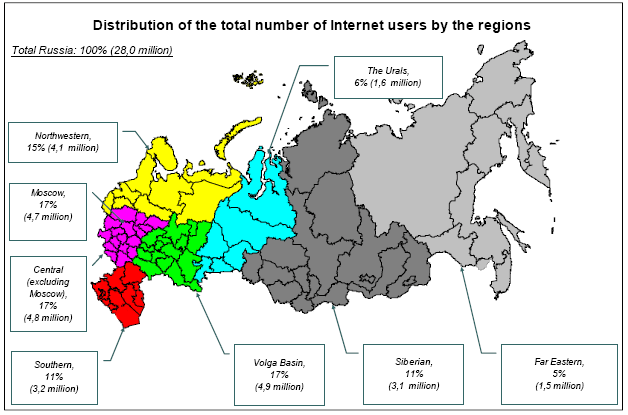
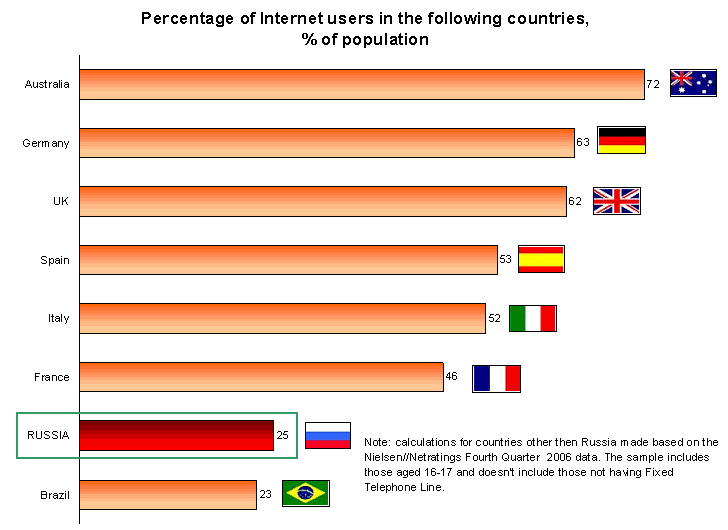
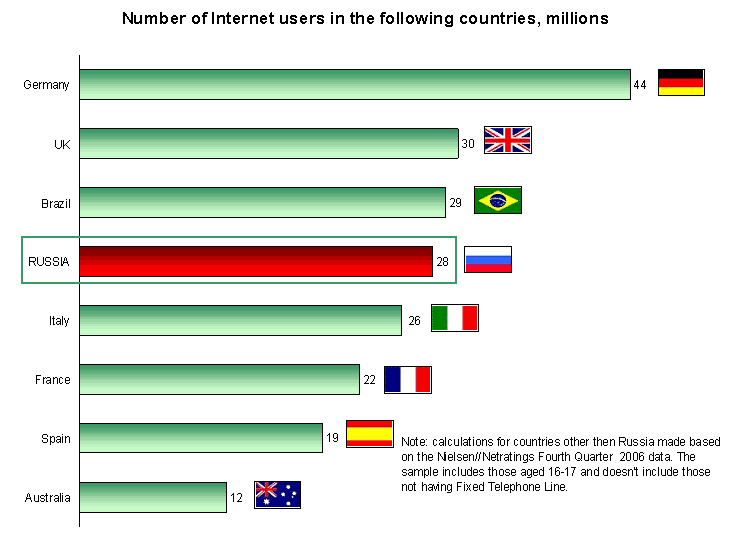
- Data source: nationwide poll conducted once over two weeks
- General population: the population of Russia 18+
- Sample design: random stratified sample (employed for economic-geographical regions and urban/rural population), and a three-stage sample (administrative regions – polling stations – households)
- Selected sample units: total of 63 provinces and republics, 98 regions, 203 urban and rural settlements, 314 polling stations.
- Face-to-face interviews with 3000 respondents age 18 and older at the respondents' homes.
- Method employed – Nielsen//NetRatings Inc. method of screening Internet users.
- To each category of Internet users are assigned all those who in response to the question, "Have you ever used the Internet?
If so, when did you last do so?"
answered:
"in the last twenty-four hours," "last week," "last month," "in the last three months," "in the last six months".
- The Report 'Internet in Russia' is published 4 times a year (Spring, Summer, Fall, Winter)
- Calculations are made quarterly based on aggregate data. A total of 15-21,000 respondents were interviewed in the last 5-7 polls.
- Comparison of Russia with other countries is done based on:
Nielsen//NetRatings Global Internet Trends™ Regional Reports, Quarter 4, 2006;
October - December 2006.
- This release is based on the returns of six polls conducted in winter 2006-2007 (December-February) among a sample of 18,000 respondents.

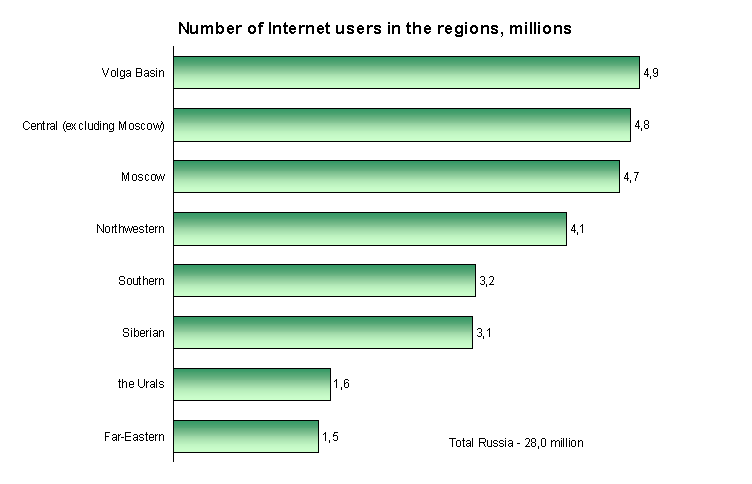
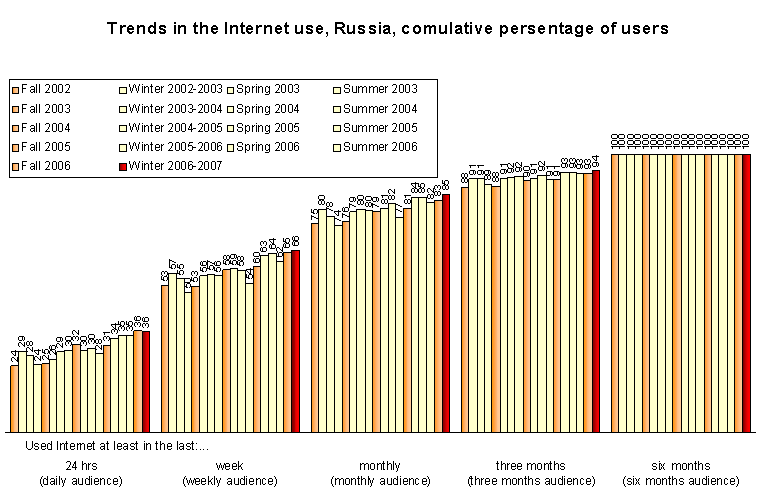
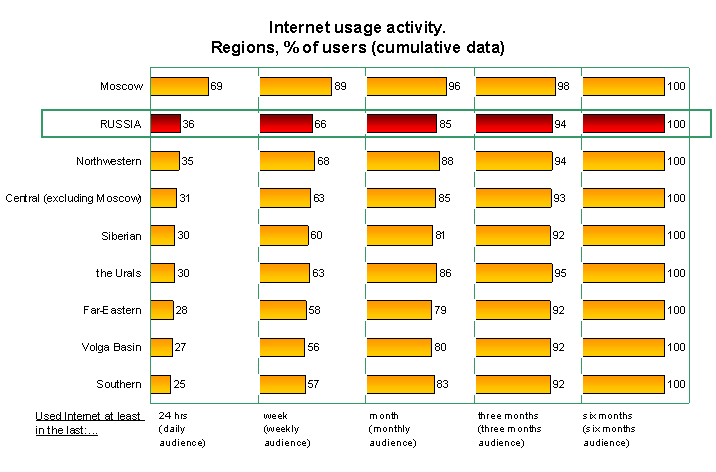
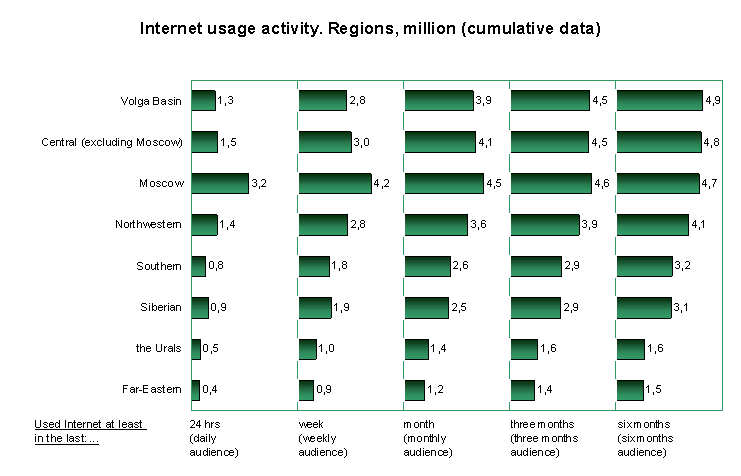
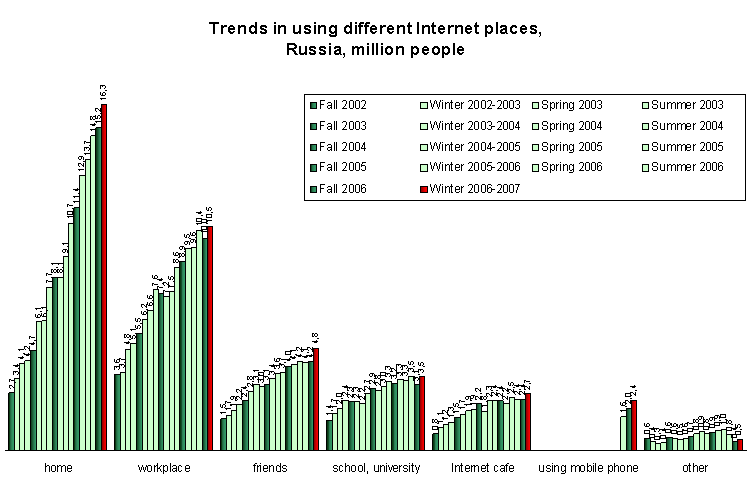
Note. Trends in the Internet use measured in million people see gr.1
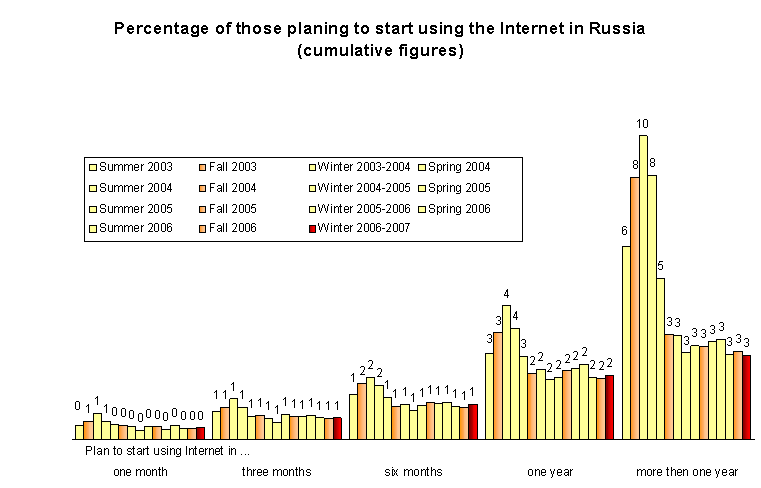
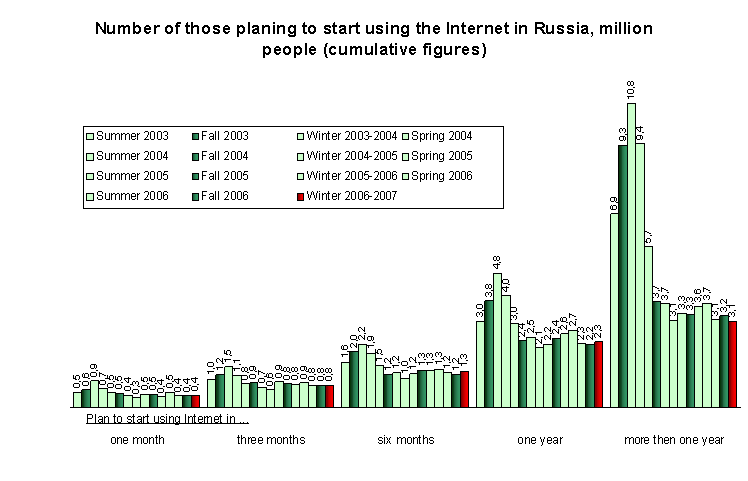
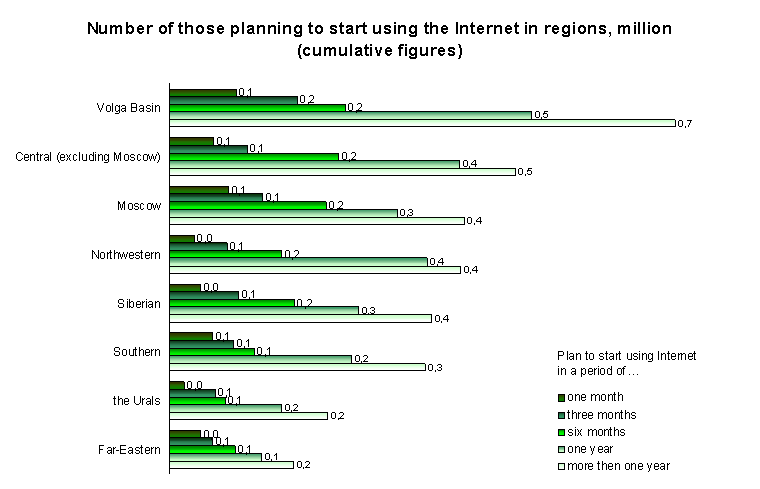
6. Internet expansion reserves
The assessment of respondents' desire to start using Internet was based on responses to following questions:
«Do you want to use Internet? If yes, when do you plan to start using it?».
The respondents were only those who do not currently use Internet.
Assessment was made among those who responded:
«within one month»,
«within three months »,
«within six months »,
«within a year »,
«more than in one year »

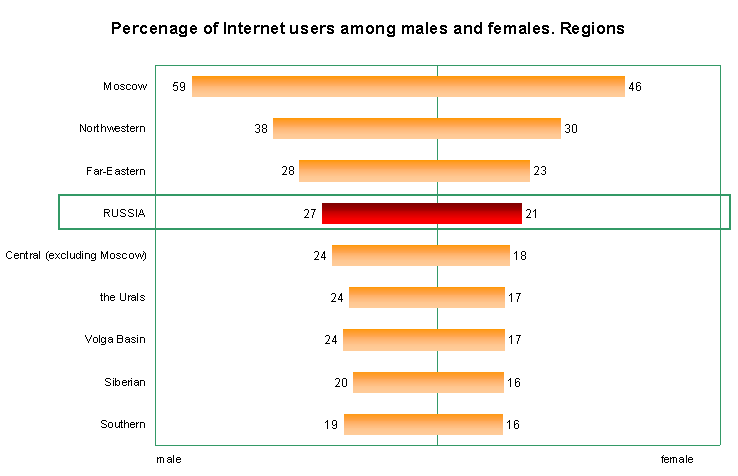

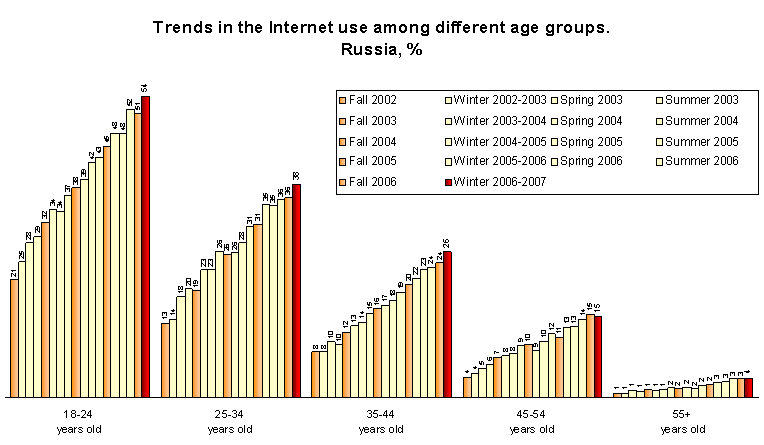
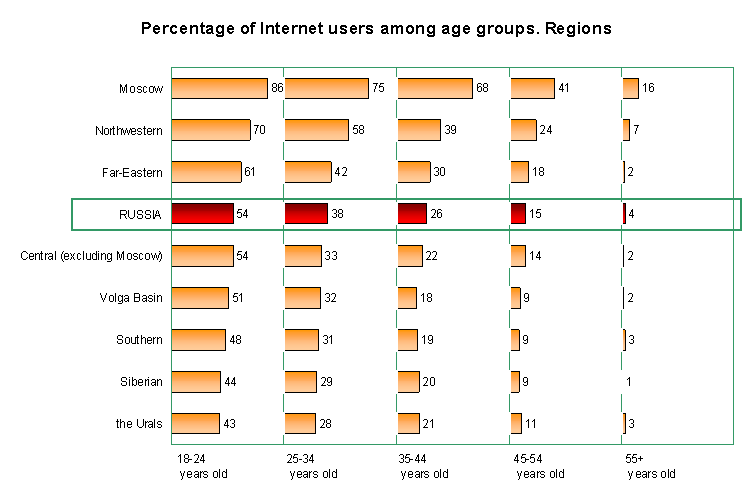
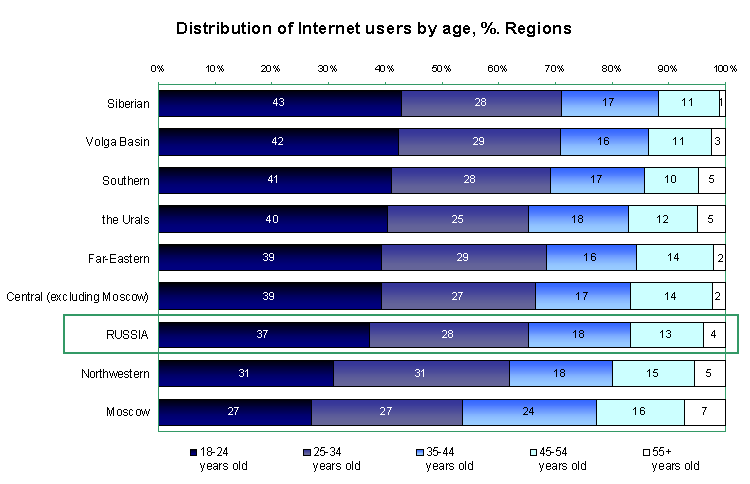
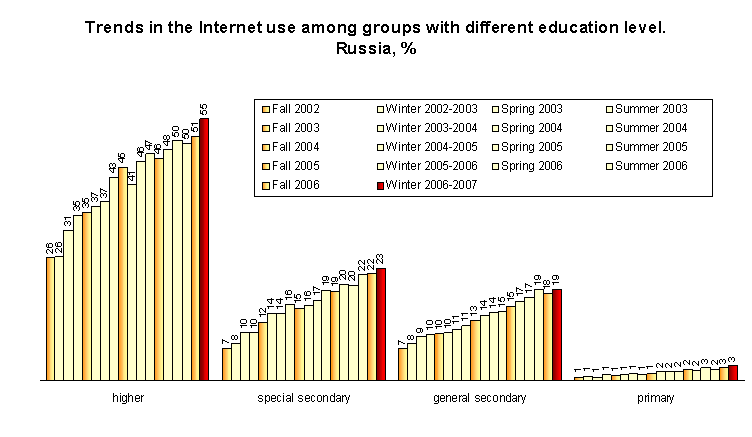
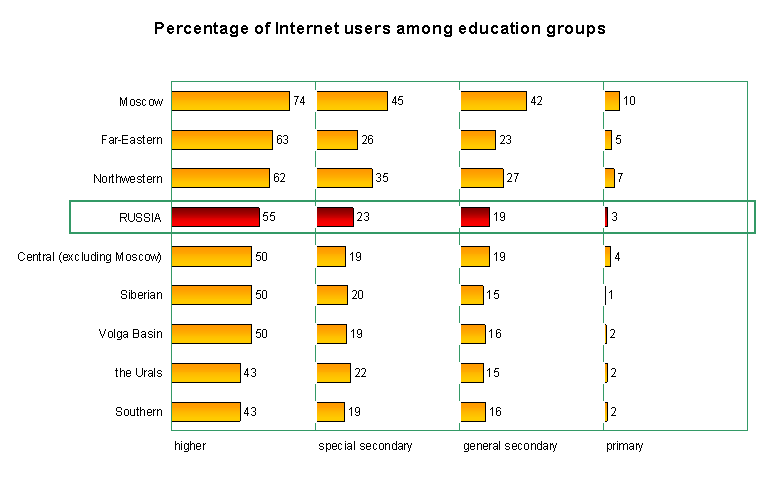
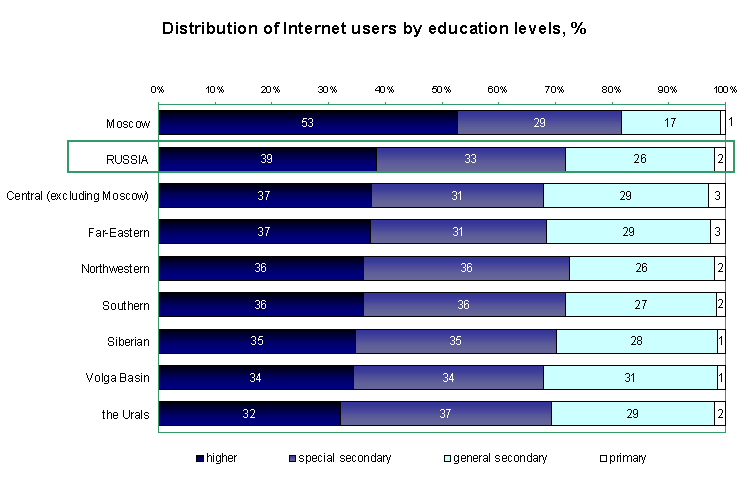
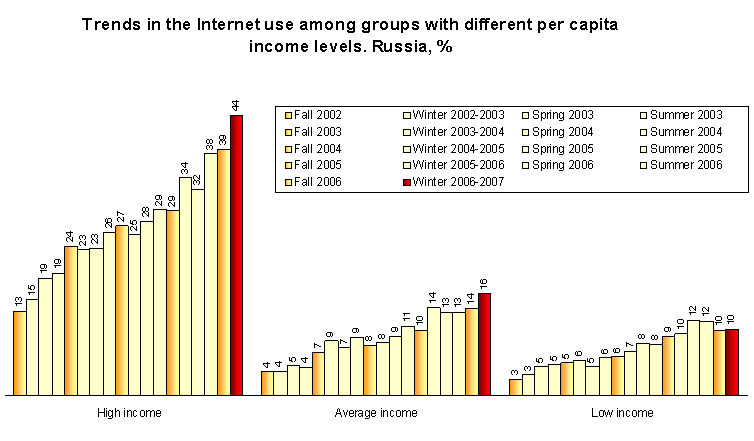
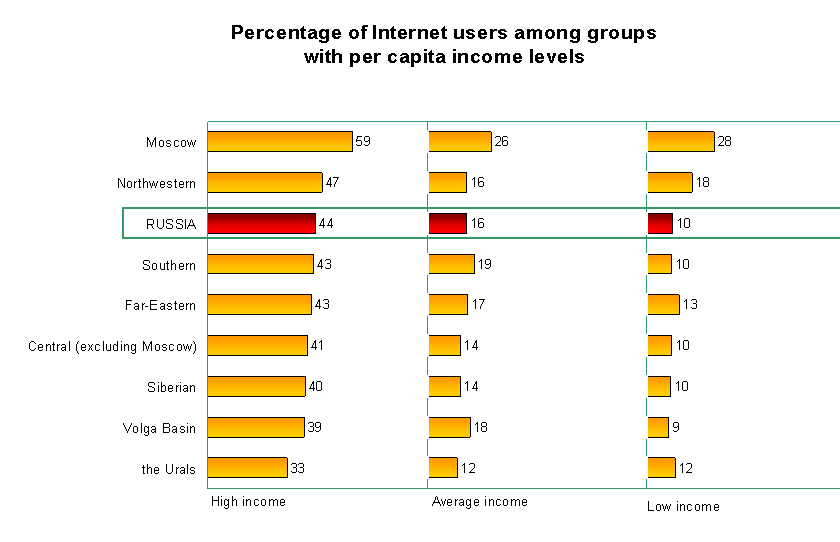
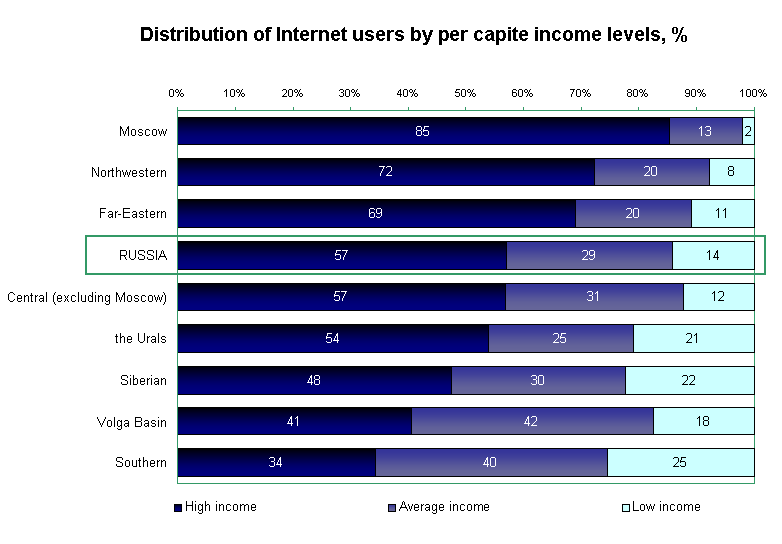
Note. All those respondents who answered the question about their per capita income were split into three groups containing approximately the same number of respondents. In winter 2006-2007 low income group respondents having less than 2500 rbl. a month, average income group – from 2500 to 4000 rbl. a month, high income group – 4001 rbl. a month and more.
Distribution of Russian population
by gender, age, education
and income, % in the columns
| |
|
REGIONS |
| |
RUSSIA |
Moscow |
Central (excludes Moscow) |
Northwestern |
Southern |
Volga Basin |
the Urals |
Siberian |
Far Eastern |
| GENDER |
| Males |
45 |
47 |
45 |
44 |
46 |
45 |
44 |
45 |
43 |
| Females |
55 |
53 |
55 |
56 |
54 |
55 |
56 |
55 |
57 |
| AGE |
| 18-24 years old |
14 |
15 |
14 |
13 |
15 |
14 |
16 |
15 |
15 |
| 25-34 years old |
17 |
18 |
16 |
18 |
17 |
17 |
18 |
18 |
18 |
| 35-44 years old |
17 |
17 |
17 |
17 |
18 |
18 |
17 |
16 |
18 |
| 45-54 years old |
22 |
22 |
23 |
22 |
21 |
23 |
21 |
22 |
21 |
| 55+ |
29 |
28 |
30 |
30 |
28 |
28 |
28 |
28 |
28 |
| EDUCATION |
| primary |
15 |
6 |
16 |
12 |
14 |
15 |
17 |
20 |
15 |
| general secondary |
34 |
24 |
34 |
35 |
33 |
38 |
36 |
31 |
35 |
| special secondary |
34 |
34 |
35 |
34 |
37 |
33 |
32 |
34 |
36 |
| higher |
17 |
36 |
16 |
19 |
16 |
14 |
15 |
14 |
14 |
| PER CAPITA INCOME |
| High income |
34 |
5 |
28 |
16 |
52 |
41 |
34 |
42 |
22 |
| Average income |
34 |
17 |
39 |
31 |
30 |
38 |
34 |
35 |
28 |
| Low income |
33 |
78 |
33 |
53 |
17 |
22 |
32 |
24 |
49 |
Distribution of Russian population by regions, %
| Moscow |
8 |
| Central (excludes Moscow) |
19 |
| Northwestern |
10 |
| Southern |
14 |
| Volga Basin |
22 |
| the Urals |
7 |
| Siberian |
15 |
| Far Eastern |
5 |
|