|
|||||||||||||||||||||||||||||||||||||||||||||||
|
World Population: Growth Rates and Demographic Trends |
|||||||||||||||||||||||||||||||||||||||||||||||
"Some time back in the 1970s, a now-forgotten writer made the statement that 75 percent of the people who had ever been born were alive at that moment" - True or False? Readings:
Questions considered in this section:
1.0 Why is population so important?
2.0 Living in an exponential age
Calculating Growth Rates (r)To calculate a population's growth rate you need make an assumption and know two things. If you assume that the growth is exponential (which it is), and if you know the population size at some initial time, N(0) and at some later time N(t), you calculate the growth rate (r) using the logarithmic growth equation: N(t) = N(0)exp(rt). rearranging, you arrive at the following as a solution for the growth rate, r, over time t
r = (ln(N(t))-ln(N(0))/t Here is a worked example of how to calculate exponential growth rates. Calculating Doubling TimesWhen will the population double? It is easy to calculate the doubling time of population (or any other quantity) using the "Rule of 70". To calculate the amount of time it will take a population to double, all you need to know is its growth rate. The "Rule of 70" is:
So, given that the present global population growth rate is 1.2%, it would take 70/1.2, or about 58 years for the world population to double from its present value near 6 Billion to a projected value of 11 Billion (!) in 2055. However, because the growth rate is not stable but declining, the population will actually be closer to 9 billion in 2055. It only took about 40 years for the world population to double from 3 to 6 billion between 1960-1999.
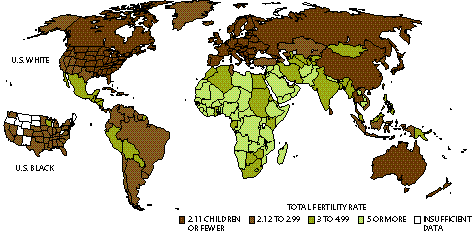
3.0 Basic factors affecting population size and growthThe two main factors affecting how Global populations change over time are the Birth Rate and the Death Rate. Regional (not global) populations can change significantly to to the additional impacts of changes in the Migration Rate. Global population change is a simple equations: Population change = Birth Rate - Death Rate There are roughly 22 births and 9 deaths per thousand people (that is, 2.2% birth rate and 0.9% death rate). 3.1 Factors influencing Birth RateThe global mean Birth Rate is 22 new births per 1000 people, or 2.2%. To appreciate the importance of this number, there are 26 new babies born every second, and 25 of these will have been born in developing countries. The primary factor affecting Birth rate is the Total Fertility Rate, which is the average number of children a woman will have during her childbearing years. The world average today is about 2.8 children per woman, but was as high as 5 children per woman in 1950 (accounting for the tremendous population growth (~2.0% compared to 1.2% today) during the mid 20th century). Both Biological and Cultural factors influence Total Fertility Rate. Biological factors include infant mortality rates and employment of birth control methods. Cultural factors are most important and include the use of children in the labor force, urbanization (see the Demographic Transition section below), education opportunities for women, marriage age, old age pension systems, cost of raising/educating children, availablity of birth control options and legal abortions, and, of course, religious and cultural norms.
An important observation is that even if we were able to match birth and death rates, population growth would still continue for another ~50 years? Why is this? Because there is still the youngest generation which have yet to enter the childbearing phase. For example, in 2001, 30% of the world population is under 15 years old. This is discussed more in the Population Pyramid section below. 3.2 Factors influencing Death RateThe global mean Death Rate is 9 deaths per 1000 people, or 0.9%. Although the birth rates differ markedly between developed and developing countries, death rates are roughly equal between developing and developed countries. Note right away that there are many more people being born than there are dying - this is gets to the core of the past and present population boom. The rapid increase in world population up to now has been a result of declining death rates, whereas future growth will be due to the imbalance between birth and death rates. Advances in medical treatments, better food supplies and nutrition, improvements in sanitation, and access to clean water have all led to the dramatic declines in death rates over the last century. There are two general measures of death rate: life expectancy and infant mortality. Consequently global life expectancy has increased from 48 to 67 years over the last half-century, and infant mortality has decreased from 2% to 0.8% over the same time. 4.0 The geography of population growthSome basic observations: 95% of the present world population growth is occurring in developing nations. Many developed countries have near zero or even negative growth rates. The population-equivalent of New York City (~8 million people) is added to the rest of world population each month. The rate of population growth has been decreasing however from ~2-3% in the mid-20th century to the 1.2% value it is today. Current trends for developed countries are toward zero- or even slightly negative population growth, whereas developing countries are trending from highly positive to less positive population growth. Because most of the world's population is in developing countries and because they have positive population growth trends, the majority of future population growth will occur in developing nations.
5.0 The Demographic Transition: The influence of economic development on population growthThe Demographic Transition refers to the impact of economic development on birth and death rates. First noted by demographers for changes in 19th-century Europe, the demographic transition is a critical shift in population growth and age structures (below) that differentiate developed nations from developing nations. A Demographic Transition typically consists of four stages: The Preindustrial Stage when there is little population growth because harse social conditions lead to both high death and high birth rates. The Transitional Stage, when industrialization begins and health care improves, resulting in lowered death rates, but birth rates remain high. Most of the developing world is in this or the next stage. The Industrial Stage, when the birth rate drops due to modernization (and its accompanying social changes) - many developed countries are in this stage and a few developing countries are entering this stage. Finally, the Postindustrial Stage is recognized by further reductions in birth rates to equal or even below death rates, approaching or even below zero population growth. Approximately 13% of the world population (mostly European countries) is in this stage.
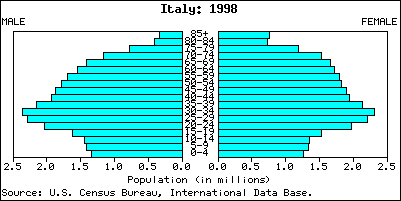
A decline in BOTH the birth and death rate is termed a complete demographic transition. 6.0 Population age structure: Interpreting population pyramidsPopulation Pyramids, or population age structure diagrams, tell a great deal about past, present, and future population trends for a given country or for the world. In brief, they are diagrams showing the age distribution (in relative percentages) of a given population. The shape of the Population Pyramid tells you immediately what phase a population group is in. Stage 2: Countries with rapid growth rates (2-3%) have a pyramid-shaped profile (such as Nigeria or Guatemala). The world average population pyramid is intermediate between the high- and low-growth rate figures. From these figures you can get a sense for the tremendous momentum for future population growth from the large base of young (<15 years old) women who have yet to enter their child bearing years (here's a great animation of how a high growth rate population pyramid evolves over time!).
Stage 3: Countries with slow growth rates (1.5-0.5%) (Stage 3) have a more pointed pyramid shape (such as the US or Canada, or even Mexico (now)).
Stage 4: Zero growth rate populations look almost like a vertical column (Such as Sweden, Spain or Austria);
Late Stage 4: Negative growth rate populations such as Italy or Germany have an inverted pyramid form.
You can access population data and pyramid plots at the US Census Bureau. Examine a few countries not listed above for yourself and see what their demographic trends are. 7.0 Slowing population growthThere is an active debate concerning whether popluations should be limited at all. On one hand, technologists argue that future technological developments will provide for greater and greater numbers of people who contribute to the economic health of the world. Another perspective holds that we cannot even provide adequately for the existing population, so how will we manage with billions more? Ultimately the question comes down to the simple facts that land area and earth resources are fixed and finite, whereas populations grow exponentially, if no measures are taken. Successful efforts to reduce population growth have been undertaken by the governments of Japan, China, South Korea, Thailand, and Iran. These countries were able to achieve replacement-level fertility (enough children born to replace death of parents) within 15-30 years - this is good news. Among the many factors affecting population growth the most significant factors were found to be:
US Census Bureau is a great resource for US and global population data and projections. Updated September 19, 2005 ©2002-5 P. deMenocal (LDEO, Columbia Univ.) |
|||||||||||||||||||||||||||||||||||||||||||||||


